Advent of Code in Production, Day 13: Observability
At this point we've designed a system and we're going to provide it as a service. To operate that service effectively we have to understand how its behaving. That's all about observability.


Continuing this journey of imagining an Advent of Code production system, it's time to give some thought to one of my favorite topics: observability. Perhaps that time should really come sooner, but it's hard to think about how to observe something until you have something to observe. In any case, we so far have a moderately complex distributed system, operating in a fairly extreme environment: the (fictionalized) north pole. We've declared ourselves the providers of this service, and that means we have to operate it. To do that at all effectively, we have to be able to tell how it's behaving.
First, I should define some terms. Or really, the one term: observability. The somewhat formal definition is that it's a measure of how well an observer could deduce the internal state of a system strictly by observing its outputs. That is, without changing the system to add new outputs or expose its internals. Somewhat less formally, it's whether you can tell what the thing is doing. Observability is an emergent quality of the system, it's not any one feature or capability. I know it's kind of a fuzzy concept, so it may help to offer a couple of counter examples; things that observability is not. First, observability is not magic. Having good observability doesn't prevent bugs, it doesn't fix broken builds, it doesn't restore bad deploys. Second, observability is not a product. It's not a tool, or a library, or a vendor (although there certainly are products that can help to improve observability and I'm going to talk about them). Rather, it's the collective result of all of the system's telemetry and functional behavior, and good observability makes detecting and finding those bugs and bad deploys and so on much faster and more successful.
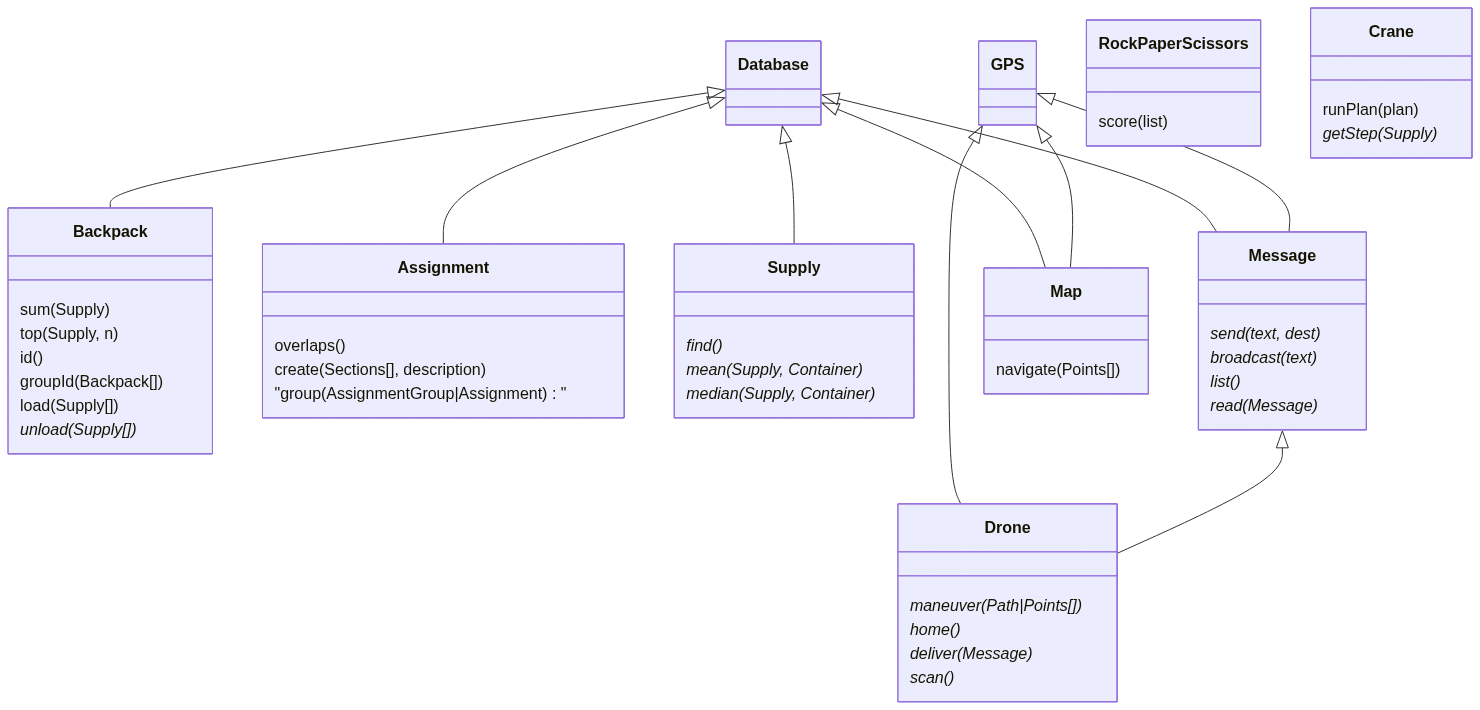
Second, let's update our system model with what we've learned about our requirements and resources over the last several days.
- Drones! We have survey drones! That's awesome! I wonder if they can be used as radio relays. I assume at minimum they can carry and relay messages. And we know they have some sensors.
- Maps and GPS. That's something I had expected, but it's still good to know.
We haven't been asked[1] to build any support for the drones, but it seems obvious that we need it. At the least, we probably want programmable flight paths. And we already needed to build pathfinding for our maps. So, I'm adding both things to SFTools.
Instrumentation
A huge part of achieving good observability is instrumenting the system to emit telemetry for you to observe. That's not the only thing, of course. Everything the system communicates is a factor. That includes regular behavior like service calls, error messages, and the actual desired output of the system. But to really understand what a system is doing, particularly when it's doing something unexpected, you're going to need purpose-built instrumentation. Lucky for me, this is an area of software engineering that's advanced dramatically in the last couple of years. The backbone of this instrumentation will be provided by OpenTelemetry.
But OpenTelemetry (aka OTel) is another of those things that isn't magic. We have to actually do some instrumentations for the appropriate kinds of telemetry. A lot of that can be automatic, but the most valuable instrumentations will be specific to our applications, and that's something we have to build for ourselves. Broadly speaking, there are three kinds of telemetry: (structured) logs, traces, and metrics. OTel can provide all of those for us, and also correlate them together. It's honestly just great. So, let's talk about what parts of our system to instrument, and in what ways.
Daemon
The main part of our application is the daemon (which I've decided is called sftd, by the way). This provides most of the logic and virtually all of the communications for the application. And it will be running continuously. Sftd gets the full suite of instrumentation. I want logs for point-in-time state. I want metrics to understand resource utilization. I need traces, particularly distributed traces, to understand how the whole system is behaving. This is the heart of where that distribution happens. Traces will allow me to follow events through the whole system. All types of telemetry have their place, but I consider traces to be the most critical one. Typically, metrics would mainly come into play when asking questions about performance. But in this system, I don't expect performance to be a primary concern. What I'm concerned about in this case is battery drain, and to a somewhat lesser extent network demand. As the system is developed and evolves to satisfy new requirements over time, I expect that any power consumption problems that come up will tend to originate here. That will be a significant focus of the metrics we collect.
CLI
The CLI (invoked as sft) will be instrumented for logs and traces. This is generally not going to be a long running process (with some possible exceptions). It will generally be invoked, hand off work to sftd, and then exit. Metrics don't make much sense in my view. I'm not certain traces will be all that interesting, either. At least not on their own. But, I would expect a CLI command to produce the root span for most traces that the system generates, and it's valuable to have that context available. Traces are really all about capturing the context of whatever bit of data you're looking at. Logs seem more valuable here than in most places. It should be rare that the CLI would do concurrent unrelated work, so the simple ordered nature of logs should be easy to work with and reflect what happened during the process.
Database
In most cases, the database will not exist as a separate process, but instead be managed directly by the daemon process. So, there's not actually much to instrument here. Except when the app is running in a host configuration. The plan is that camps would run one or more instances of SFTools more like a server in conventional client-server architectures. That is, continuously available, and acting as an authoritative source for the state of the whole data model. In that case, we're probably better off letting client instances of SFTools connect directly to a Dolt DBMS to do their merge and sync operations. And in that case, we definitely want to get logs and metrics out of it. I'm not certain whether it's possible to get traces, and it's likely not critical anyway. Database operations[2] will generally not have direct distributed effects, so we don't need a tracing system on the database to propagate tracing context downstream to other parts of the system. Otherwise, we mainly just want to be sure that the database libraries we use in the daemon are captured with spans in our traces.
Operating System
The total state of the devices themselves is going to be of great interest to us as operators of this system. We get that information from the operating system. It presumably generates its own system logs, and we'll want to capture those. It also can provide us with other status information that would be useful as metrics. I'm thinking about battery stats in particular, but this would also be true of any other hardware. We want to know what the CPU, RAM, disk, and radios are doing. And if there are other processes running on these communicators, we want to know what they are and how they're affecting the device.
Collecting that kind of information about CPU and memory activity is likely straightforward. Operating systems include tools to do that, and we can just use those. But the disk and radios may be another matter. In those cases, if there's not easier options, we may need to patch the filesystem and hardware drivers[3] to expose some of their internal state and to generate events we can collect. I would consider doing that for the radios because they are likely to be a meaningful source of power consumption. And I would consider doing that for the filesystem because we've already had one instance of a disk being inexplicably full. Think of that as an action item that came out of the incident review.
Collection
I think that covers the most critical kinds of telemetry we should collect. But how will we collect it? That's not to ask how we will instrument the system to emit telemetry. At the level of this series, the answer is OpenTelemetry. Rather, where do we send that telemetry? We still have the same concerns about preserving battery and the unavailability of the network. In another system, the answer to this question would be to use the OpenTelemetry Collector and call it a day. The thing is, I don't know how well the collector will deal with a persistently unavailable backend. I know it will do a good job of handling occasional interruptions, but does that extend to the backend (and indeed, the entire network) being unavailable for hours? And I'd be surprised if it's optimized for power consumption.
In any case, there will be times that we'll need to serialize telemetry to disk and store it for later collection. I see two options to accomplish that. One, is to test and possibly patch the collector service for optimized power consumption. That sounds like a lot of work, and it could run counter to a lot of the design goals of the collector project, which is to optimize performance and throughput. The other is to export our telemetry directly to disk, and have a secondary process gather and ship it to an analytic backend sometime later. That process could be triggered by charging the battery or connecting to the network. I think that will be less work, but it introduces more failure modes. In particular, it exacerbates the risk that we could fill the device's filesystem with telemetry data and inadvertently cause some of the problems this whole process was seeking to avoid. Still, this is a fast-moving project, and this seems like it can be made functional in the space of days. Patching the collector could take weeks or months. I would opt for the direct-to-disk plan and keep the battery-optimized collector as an option for future exploration.
flowchart BT
    subgraph node1 [Communicator]
        direction BT
        cli1(CLI) --> d1[Daemon]
        d1 --> db1[(Database)]
        d1 ---> gps{{GPS}}
        d1 ---> drone{{Drone}}
        d1 --> disk[(Telemetry)]
        ex[[Exporter]] --> disk
        end
Advent of Code
As I write this, we've spent more of the Advent of Code narrative lost in the wilderness than participating in the elves' expedition. We sometimes learn about new capabilities of the communicator device. Aside from that, it's getting a little hard to continue to evolve the system. I'm still solving the challenges as code problems. I'm pretty behind and there's basically no chance I'll finish on time. But I might finish before the end of the year. As always, you're welcome to peruse my solutions. Other than that, I don't know what more I'll have to add to this series. This might be the last entry. Unless it's not. We'll see.
Cover photo by Meruyert Gonullu
Footnotes
This thought experiment is getting into areas that I am very much not an expert. I'm making a lot of assumptions, and if any of them are seriously wrong, I guess you can let me know? Otherwise, I dunno, bear with me on it.
[1]: Full disclosure; I'm quite behind on doing the challenges, so I haven't read part 2 of the recent days.
[2]: Other than merges. But merges should be pretty easy to track by their nature. Including them in other telemetry would be convenient, but probably not strictly necessary.
[3]: I'm not a hardware girl. I'm even less a radios girl. I'm assuming something like this is realistic, but I have no idea how I would go about it. If this was a real project, I would bring on a hardware girl to help with it.